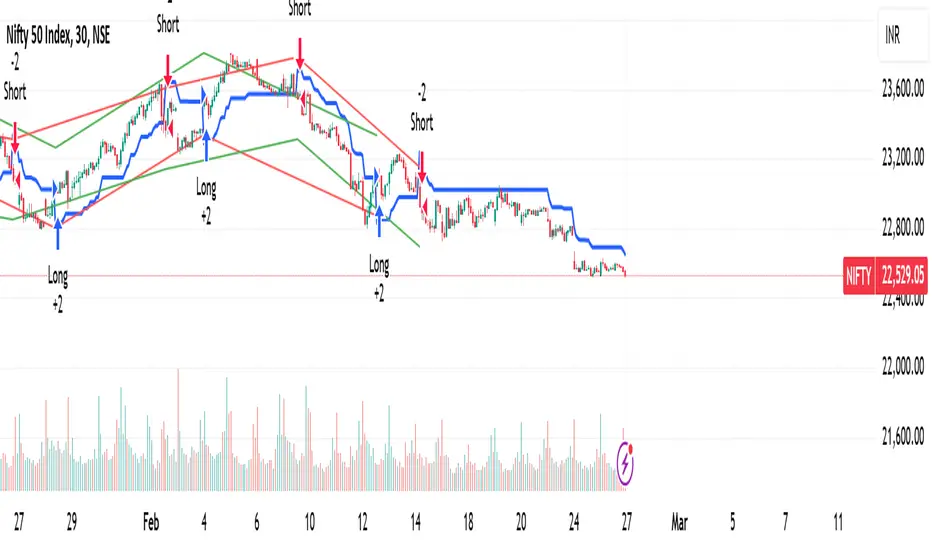
Supertrend with 1% Target and 1% StoplossSupertrend Calculation: The Supertrend indicator is calculated using the Average True Range (ATR) and a factor. The factor and ATR length can be adjusted in the inputs.
Long and Short Conditions: The strategy enters a long position when the price crosses above the Supertrend line and a short position when the price crosses below it.
Target and Stop Loss: The strategy places a 1% target and a 1% stop loss for both long and short positions.
Visuals: The stop loss and take profit levels are plotted on the chart for better visibility.
Cerca negli script per "stop loss"
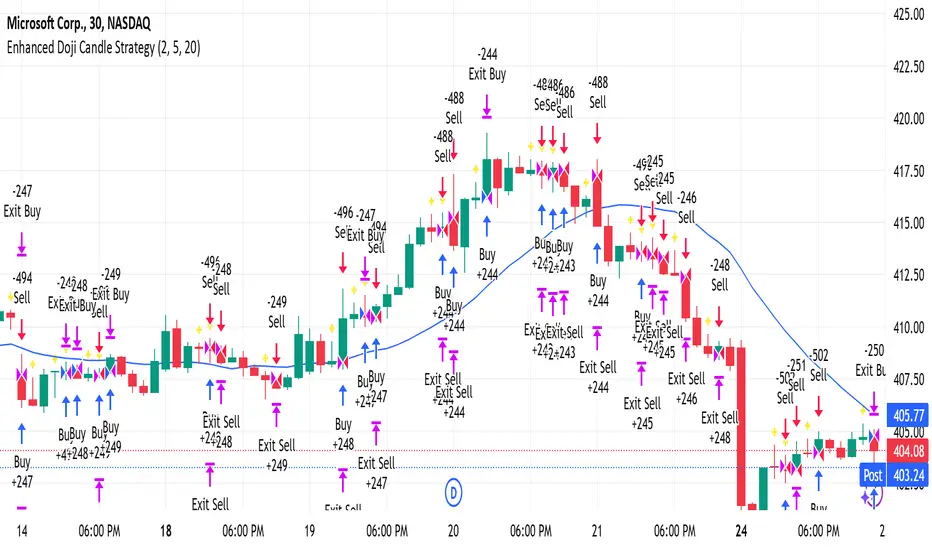
Enhanced Doji Candle StrategyYour trading strategy is a Doji Candlestick Reversal Strategy designed to identify potential market reversals using Doji candlestick patterns. These candles indicate indecision in the market, and when detected, your strategy uses a Simple Moving Average (SMA) with a short period of 20 to confirm the overall market trend. If the price is above the SMA, the trend is considered bullish; if it's below, the trend is bearish.
Once a Doji is detected, the strategy waits for one or two consecutive confirmation candles that align with the market trend. For a bullish confirmation, the candles must close higher than their opening price without significant bottom wicks. Conversely, for a bearish confirmation, the candles must close lower without noticeable top wicks. When these conditions are met, a trade is entered at the market price.
The risk management aspect of your strategy is clearly defined. A stop loss is automatically placed at the nearest recent swing high or low, with a tighter distance of 5 pips to allow for more trading opportunities. A take-profit level is set using a 2:1 reward-to-risk ratio, meaning the potential reward is twice the size of the risk on each trade.
Additionally, the strategy incorporates an early exit mechanism. If a reversal Doji forms in the opposite direction of your trade, the position is closed immediately to minimize losses. This strategy has been optimized to increase trade frequency by loosening the strictness of Doji detection and confirmation conditions while still maintaining sound risk management principles.
The strategy is coded in Pine Script for use on TradingView and uses built-in indicators like the SMA for trend detection. You also have flexible parameters to adjust risk levels, take-profit targets, and stop-loss placements, allowing you to tailor the strategy to different market conditions.
Grim SlashOverview:
The Touch Previous Candle Strategy is a simple yet effective trading approach designed for the 1-hour chart. It focuses on price action by placing trades when the current candle interacts with key levels from the previous candle. The strategy is fully automated and includes risk management with take profit and stop loss levels.
Entry Conditions:
Buy Signal: A buy order is triggered when the low of the current candle touches or drops below the previous candle's closing price.
Sell Signal: A position is closed when the high of the current candle reaches or exceeds the previous candle's highest price.
Risk Management:
Take Profit: The trade is exited automatically when the price increases by 15% from the entry point.
Stop Loss: A stop loss is set at 5% below the entry price to minimize risk.
Best Use Cases:
Works well in volatile markets where price frequently tests previous levels.
Suitable for traders who prefer price-action-based strategies over indicators.
Can be optimized for different assets or timeframes based on market behavior.
Candlesticks Not Touching EMA 3 & EMA 5 ScannerCandlesticks Not Touching EMA 3 & EMA 5 Scanner
Short Title: EMA Scanner
Overview
This indicator scans for candlesticks that do not touch the EMA 3 and EMA 5, highlighting potential trading opportunities where price action is significantly distanced from these moving averages. It identifies momentum-based entries and helps traders spot strong trends.
How It Works
It checks if the candle's high and low are completely above or below both EMAs (3 & 5).
It ensures that the distance between the candle and EMA 5 is at least a user-defined multiple of the candle range.
When a valid candle is detected, a triangle marker appears below (for long trades) or above (for short trades).
Trade Execution Strategy
Entry:
Long Entry → Break of the candle’s high
Short Entry → Break of the candle’s low
Stop Loss:
Long SL → Low of the same candle
Short SL → High of the same candle
Target: EMA 5
Additional Features
✅ Plots EMA 3 (Blue) and EMA 5 (Red) for reference
✅ Marks potential long and short trades with arrows
✅ Detects & plots when Target or Stop Loss is hit
✅ Alerts for valid signals, target hits, and stop loss hits
Best Use Cases
🔹 Suitable for intraday & swing traders looking for momentum-based trades
🔹 Works well in trending markets
🔹 Helps identify mean-reversion & breakout opportunities
🚀 Use this indicator to refine your trading setups & boost your market edge! 🚀

John Bob-Trading-BotDeveloped by Ayebale John Bob with the help of his bestie, this innovative strategy combines advanced Smart Money Concepts with practical risk management tools to help traders identify and capitalize on key market moves.
Key Features:
Smart Money Concepts & Fair Value Gaps (FVG):
The strategy monitors price action for fair value gaps, which are visualized as extremely faint horizontal lines on the chart. These FVGs signal potential areas where institutional traders might have entered or exited positions.
Dynamic Entry Signals:
Buy signals are triggered when the price crosses above the 50-bar lowest low or when a bullish FVG is detected. Conversely, sell signals are generated when the price falls below the 50-bar highest high or a bearish FVG is identified. Each signal is visually marked on the chart with clear buy (green) and sell (red) labels.
Multi-Level Order Execution:
Once an entry signal occurs, the strategy places five separate orders, each with its own take-profit (TP) level. The TP levels are calculated dynamically using the Average True Range (ATR) and a set of predefined multipliers. This allows traders to scale out of positions as the market moves favorably.
Dynamic Risk Management:
A stop-loss is automatically set at a distance determined by the ATR, ensuring that risk is managed in accordance with current market volatility.
Real-Time Trade Information Table:
In the bottom-right corner of the chart, a trade information table displays essential details about the current trade:
Side: Displays "BUY NOW" (with a dark green background) for long entries or "SELL NOW" (with a dark red background) for short entries.
Entry Price & Stop-Loss: Shows the entry price (highlighted in green) and the corresponding stop-loss level (highlighted in red).
Take-Profit Levels: Lists the five TP levels, each of which turns green once the market price reaches that target.
Timer: A live timer in minutes counts from the moment the current trade trigger started, helping traders track the duration of their active trades.
Visual Progress Bar:
A histogram-style progress bar is plotted on the chart, visually representing the percentage gain (or loss) relative to the entry price.
This strategy was meticulously designed to incorporate both technical analysis and smart risk management, offering a robust trading solution that adapts to changing market conditions. Whether you're a seasoned trader or just starting out, the AyebaleJohnBob Trading Bot equips you with the tools and visual cues needed to make well-informed trading decisions. Enjoy a seamless blend of strategy and style—crafted with passion by Ayebale John Bob and his bestie!

Scalping trading system based on 4 ema linesScalping Trading System Based on 4 EMA Lines
Overview:
This is a scalping trading strategy built on signals from 4 EMA moving averages: EMA(8), EMA(12), EMA(24) and EMA(72).
Conditions:
- Time frame: H1 (1 hour).
- Trading assets: Applicable to major currency pairs with high volatility
- Risk management: Use a maximum of 1-2% of capital for each transaction. The order holding time can be from a few hours to a few days, depending on the price fluctuation amplitude.
Trading rules:
Determine the main trend:
Uptrend: EMA(8), EMA(12) and EMA(24) are above EMA(72).
Downtrend: EMA(8), EMA(12) and EMA(24) are below EMA(72).
Trade in the direction of the main trend** (buy in an uptrend and sell in a downtrend).
Entry conditions:
- Only trade in a clearly trending market.
Uptrend:
- Wait for the price to correct to the EMA(24).
- Enter a buy order when the price closes above the EMA(24).
- Place a stop loss below the bottom of the EMA(24) candle that has just been swept.
Downtrend:
- Wait for the price to correct to the EMA(24).
- Enter a sell order when the price closes below the EMA(24).
- Place a stop loss above the top of the EMA(24) candle that has just been swept.
Take profit and order management:
- Take profit when the price moves 20 to 40 pips in the direction of the trade.
Use Trailing Stop to optimize profits instead of setting a fixed Take Profit.
Note:
- Do not trade within 30 minutes before and after the announcement of important economic news, as the price may fluctuate abnormally.
Additional filters:
To increase the success rate and reduce noise, this strategy uses additional conditions:
1. The price is calculated only when the candle closes (no repaint).
2. When sweeping through EMA(24), the price needs to close above EMA(24).
3. The closing price must be higher than 50% of the candle's length.
4. **The bottom of the candle sweeping through EMA(24) must be lower than the bottom of the previous candle (liquidity sweep).
---
Alert function:
When the EMA(24) sweep conditions are met, the system will trigger an alert if you have set it up.
- Entry point: The closing price of the candle sweeping through EMA(24).
- Stop Loss:
- Buy Order: Place at the bottom of the sweep candle.
- Sell Order: Place at the top of the sweep candle.
---
Note:
This strategy is designed to help traders identify profitable trading opportunities based on trends. However, no strategy is 100% guaranteed to be successful. Please test it thoroughly on a demo account before using it.

Adaptive Fractal Grid Scalping StrategyThis Pine Script v6 component implements an "Adaptive Fractal Grid Scalping Strategy" with an added volatility threshold feature.
Here's how it works:
Fractal Break Detection: Uses ta.pivothigh and ta.pivotlow to identify local highs and lows.
Volatility Clustering: Measures volatility using the Average True Range (ATR).
Adaptive Grid Levels: Dynamically adjusts grid levels based on ATR and user-defined multipliers.
Directional Bias Filter: Uses a Simple Moving Average (SMA) to determine trend direction.
Volatility Threshold: Introduces a new input to specify a minimum ATR value required to activate the strategy.
Trade Execution Logic: Places limit orders at grid levels based on trend direction and fractal levels, but only when ATR exceeds the volatility threshold.
Profit-Taking and Stop-Loss: Implements profit-taking at grid levels and a trailing stop-loss based on ATR.
How to Use
Inputs: Customize the ATR length, SMA length, grid multipliers, trailing stop multiplier, and volatility threshold through the input settings.
Visuals: The script plots fractal points and grid levels on the chart for easy visualization.
Trade Signals: The strategy automatically places buy/sell orders based on the detected fractals, trend direction, and volatility threshold.
Profit and Risk Management: The script includes logic for taking profits and setting stop-loss levels to manage trades effectively.
This strategy is designed to capitalize on micro-movements during high volatility and avoid overtrading during low-volatility trends. Adjust the input parameters to suit your trading style and market conditions.

Futures Engulfing Candle Size Strategy (Ticks, TP/SL)The Futures Candle Size Strategy is designed to identify and trade significant price movements in the futures market based on candle size. It is optimized for futures instruments like ES, NQ, or CL, where precise tick-level calculations are essential. The strategy includes a customizable take profit and stop loss in ticks and operates only within a specified time window (e.g., 7:00 AM to 9:15 AM CST).
Key Features:
Candle Size Threshold: Trades are triggered when the candle's high-to-low range exceeds the defined threshold in ticks.
Time Filter: Limits trades to the most active market hours, specifically between 7:00 AM and 9:15 AM CST.
Take Profit and Stop Loss: Customizable exit levels in ticks to manage risk and lock in profits.
Long and Short Trades: Automatically places buy or sell orders based on the candle's direction (bullish or bearish).
Alerts: Sends alerts whenever a trade is triggered, helping you stay informed in real-time.
How It Works:
The strategy calculates the size of each candle in ticks and compares it to the user-defined threshold.
If the candle size meets or exceeds the threshold within the specified time range, it triggers a long or short trade.
The trade automatically exits when the price hits the take profit or stop loss levels.

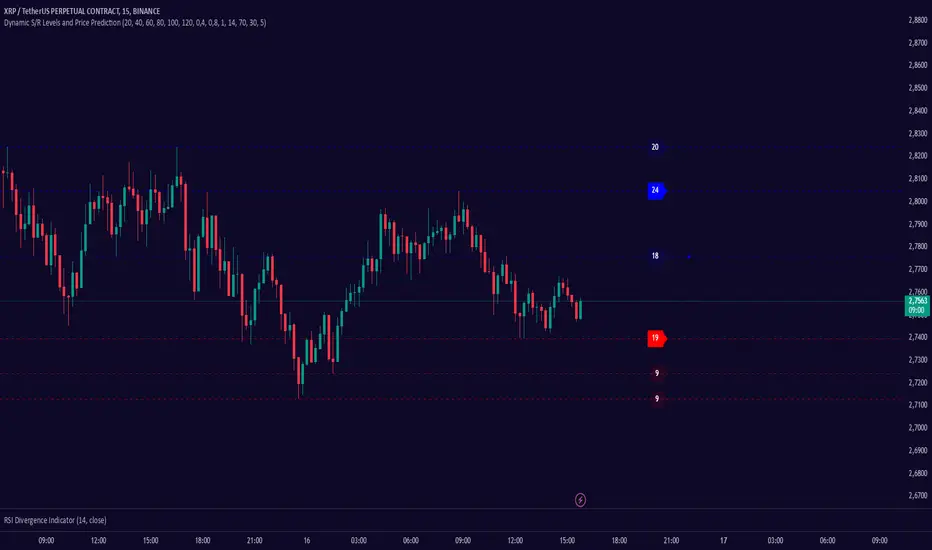
Dynamic S/R Levels: Edge FinderOverview
The Dynamic S/R Levels: Edge Finder indicator is designed to identify dynamic support and resistance levels based on historical price action. It uses a combination of price extremes (highs and lows) over user-defined lookback periods, weighted moving averages (WMAs), and touch-count analysis to provide actionable insights into key market levels.
This tool is ideal for traders who want to:
Identify dynamic support and resistance zones.
Understand the strength of these levels based on price touches.
Make informed decisions using clear, adaptive levels.
How It Works
Dynamic Levels Calculation:
The indicator calculates dynamic support levels using the lowest lows and dynamic resistance levels using the highest highs over user-defined lookback periods (e.g., 20, 40, 60 bars, etc.).
These levels are updated dynamically as new price data becomes available.
Touch Count Analysis:
The indicator counts how many times the price has touched or come close to each support/resistance level within the lookback period.
Levels with more touches are considered stronger and are highlighted accordingly.
Weighted Moving Averages (WMAs):
The indicator uses 50-period and 100-period WMAs to identify the closest support/resistance levels to the current trend.
Levels near these WMAs are given additional weight, as they are more likely to act as significant barriers.
Level Merging:
If two support or resistance levels are too close to each other (based on the minimum distance percentage), the weaker level (with fewer touches) is removed to avoid clutter.
Visualization:
Support levels are displayed as dashed red lines, and resistance levels are displayed as dashed blue lines.
Each level is labeled with its corresponding touch count, allowing traders to quickly assess its strength.
How to Interpret the Indicator
Strong Support/Resistance Levels:
Levels with higher touch counts (e.g., 5, 10, or more) are considered stronger and are more likely to hold in the future.
Use these levels to plan entries, exits, or stop-loss placements.
Proximity to WMAs:
Levels closest to the 50-period or 100-period WMA are more significant, especially in trending markets.
These levels often act as dynamic barriers where price reactions are more likely.
Breakouts and Rejections:
If the price breaks through a strong resistance level, it may indicate a potential bullish trend.
If the price rejects a strong support level, it may indicate a potential bearish trend.
Always confirm breakouts or rejections with additional analysis (e.g., volume, candlestick patterns).
Level Merging:
Merged levels indicate areas of high confluence, where multiple support/resistance zones overlap.
These areas are particularly important for decision-making, as they represent stronger market reactions.
Key Features
Customizable Lookback Periods: Adjust the lookback periods for each dynamic level to suit your trading style.
Touch Count Labels: Quickly identify the strength of each level based on the number of price touches.
Adaptive Levels: The indicator dynamically updates levels based on recent price action.
Clean Visualization: Levels are automatically merged to avoid clutter and provide a clear view of the market structure.
Usage Tips
Trend Identification: Combine the indicator with trend-following tools (e.g., moving averages, trendlines) to confirm the overall market direction.
Risk Management: Use the identified levels to set stop-loss orders or take-profit targets.
Timeframe Flexibility: The indicator works on all timeframes, but it is particularly effective on higher timeframes (e.g., 1H, 4H, Daily) for more reliable levels.
Example Scenarios
Bounce Trade:
If the price approaches a strong support level (high touch count) and shows signs of rejection (e.g., bullish candlestick patterns), consider a long position with a stop-loss below the support level.
Breakout Trade:
If the price breaks above a strong resistance level with high volume, consider a long position with a target at the next resistance level.
Range-Bound Market:
In a sideways market, use the support and resistance levels to identify range boundaries and trade bounces between them.
Disclaimer
Dynamic S/R Levels: Edge Finder is a technical analysis tool designed to identify dynamic support and resistance levels based on historical price action. It is intended for informational and educational purposes only. This indicator does not provide financial, investment, or trading advice. Users are solely responsible for their trading decisions and should conduct their own research and analysis before making any trades. The developer of this tool is not liable for any financial losses or damages resulting from the use of this indicator. Trading in financial markets involves risk, and you should only trade with capital you can afford to lose.
Enhanced VIP-like IndicatorSettings Breakdown Tutorial: Optimizing a Trading Strategy
This guide explains the key trading strategy settings and how to customize them based on your trading style and goals. Each parameter is essential for tailoring the strategy to market conditions and your risk appetite.
1. Short Moving Average Length (Default: 9)
• Purpose: Tracks short-term trends using a small number of candles.
• Settings Tips:
• Smaller Values (e.g., 9): Quickly react to price changes, useful for fast-moving markets.
• Larger Values (e.g., 12-15): Generate smoother signals for less volatile trades.
2. Long Moving Average Length (Default: 21)
• Purpose: Identifies long-term trends.
• Settings Tips:
• Higher Values (e.g., 50): Spot broader trends at the expense of slower signals.
• Trend Analysis: The interaction of short and long MAs helps determine bullish or bearish trends (e.g., bullish when short MA crosses above long MA).
3. Higher Timeframe MA Length (Default: 200)
• Purpose: Filters long-term trends on a higher timeframe (e.g., daily).
• Settings Tips:
• 200 Periods: Standard for defining bullish (price above) or bearish (price below) markets.
• Adjustable: Use 100 for faster responses or stick with 200 for reliability.
4. Higher Timeframe (Default: 1 Day)
• Purpose: Defines the timeframe for the higher moving average.
• Settings Tips:
• Shorter Timeframes (e.g., 4 Hours): More frequent trading signals.
• Daily Timeframe: Best for swing trading and identifying macro trends.
5. RSI Length (Default: 14)
• Purpose: Measures momentum over a specific number of candles.
• Settings Tips:
• Lower Values (e.g., 7): More sensitive to price changes, ideal for quick trades.
• Higher Values (e.g., 20): Smooth signals for more stable markets.
6. RSI Overbought (70) and Oversold (30) Levels
• Purpose: Marks thresholds for overbought and oversold conditions.
• Settings Tips:
• Stricter Levels (e.g., 80/20): Fewer, higher-quality signals.
• Looser Levels (e.g., 65/35): More frequent signals, suitable for active trading.
7. Pivot Left Bars (5) and Pivot Right Bars (5)
• Purpose: Confirms pivot points (support/resistance) based on surrounding candles.
• Settings Tips:
• Higher Values (e.g., 10): Stronger but less frequent pivot points.
• Lower Values: More responsive, for traders seeking quick pivots.
8. Take Profit Percentage (Default: 2%)
• Purpose: Defines the profit level to exit trades.
• Settings Tips:
• Higher Values (e.g., 5%): For swing traders holding positions longer.
• Lower Values (e.g., 1%): For scalpers focusing on quick trades.
9. Minimum Volume (Default: 1,000,000)
• Purpose: Ensures sufficient liquidity for trading.
• Settings Tips:
• Lower Values: For lower-volume markets.
• Higher Values: Reduces risk in high-liquidity assets.
10. Stop Loss Percentage (Default: 1%)
• Purpose: Sets the maximum acceptable loss per trade.
• Settings Tips:
• Lower Values (e.g., 0.5%): Reduces risk, suited for conservative trading.
• Higher Values (e.g., 2%): Allows more price fluctuation, ideal for volatile markets.
11. Entry Conditions
• Options:
• MA Crossover & RSI: Combines trend-following and momentum for well-rounded signals.
• Pivot Breakout: Focuses on support/resistance breakouts for high-impact trades.
• Settings Tips:
• Trend-Following Traders: Use MA Crossover & RSI.
12. Exit Conditions
• Options:
• Opposite Signal: Exits when the trade’s opposite condition occurs (e.g., bullish to bearish).
• Fixed Take Profit/Stop Loss: Exits based on predefined profit/loss thresholds.
• Settings Tips:
• Opposite Signal: Ideal for trend-following strategies.
Summary
Customizing these settings aligns the strategy with your trading goals. Test configurations in a demo environment before live trading to refine the approach and optimize results. Always balance profit potential with risk management.
• Fixed Levels: Better for strict risk management.
• Breakout Traders: Opt for Pivot Breakout.

Follow Through Day (FTD) + Sweep [TrendX_]The Follow Through Day (FTD) + Sweep indicator is a Trend-following tool mixing William O'Neil's original FTD concept and Liquidity concept. This indicator helps you identify potential subsequent bullish trends with greater precision by combining volume analysis, price action, and liquidity concepts.
💎 FEATURES
Follow Through Day Candle (FTD Candle)
The FTD, pioneered by William O'Neil, serves as a reliable signal for identifying the beginning of new bull markets. It's particularly valuable because it combines multiple market factors - price action, volume, and timing - to confirm genuine market reversals rather than temporary bounces.
The power of the FTD lies in its ability to distinguish between ordinary market fluctuations and significant trend changes. By requiring specific criteria to be met across multiple sessions, it helps filter out false signals and identifies high-probability reversal points where institutional investors are likely beginning to accumulate positions.
Sweep Area
The Sweep area feature enhances the traditional FTD concept by incorporating modern liquidity analysis. This overlay identifies zones where large market participants are likely to trigger stop losses before continuing the trend. These areas often represent optimal entry points for traders looking to join the new uptrend with reduced risk.
🔎 BREAKDOWN
FTD Candle
The FTD formation process occurs in two distinct phases: Setup and Completion.
Setup Phase
Strong Market Decline
The market must first experience a significant downtrend
This selling pressure helps clear out weak hands and creates oversold conditions
The decline creates the potential energy for a powerful reversal
First Recovery Session
Marks the initial sign of buying pressure emerging
Often characterized by a strong reversal candle
Represents the first indication that selling pressure may be exhausting
Recovery Confirmation
The second and third days must maintain prices above the new pivot low
This consolidation period helps confirm the validity of the initial bounce
Shows that sellers are no longer in control of price action
Completion Phase:
Supply Test Session
Low volume indicates diminishing selling pressure
Price remains above the pivot low
Creates the foundation for institutional buyers to begin accumulating
Breakout Day
Price increase exceeds average profit of bullish candles
Volume increases by at least 15% compared to previous session
Shows strong institutional commitment to the new uptrend
Timing Window
Must occur between the 4th and 8th candle after First Recovery Session
This specific timing helps confirm the sustainability of the reversal
Based on O'Neil's research of historical market bottoms
FTD Sweep
The Post-FTD Phase introduces the Sweep concept, which is crucial for understanding how large market participants operate. This feature leverages the liquidity concept because institutional traders often need to trigger stop losses to accumulate larger positions at better prices. This helps:
Create liquidity pools for large position entries
Shake out weak hands before continuing the trend
Test the strength of the new trend by absorbing selling pressure
⚙️ USAGE
Sweep + TP & SL Strategy
Example: BTCUSDT (1D) - Replay back to 9th November 2024
After an FTD candle forms, traders can adopt a systematic approach to enhance their trading strategy. First, they should determine the swing range and convert the post-FTD zone into concrete stop loss and take profit levels, which are based on the price action during the FTD formation. Next, traders should wait for a sweep formation, as this indicates that institutional players are accumulating positions. A quick price rejection from the sweep level should be observed before executing an entry.
The reasoning behind this strategy is rooted in market microstructure. By waiting for the sweep, traders position themselves alongside institutional players who need to build large positions without causing adverse price movement. The sweep creates the liquidity they need, and the subsequent move often represents the true trend continuation.
DISCLAIMER
This indicator is not financial advice, it can only help traders make better decisions. There are many factors and uncertainties that can affect the outcome of any endeavor, and no one can guarantee or predict with certainty what will occur. Therefore, one should always exercise caution and judgment when making decisions based on past performance.

Snipe 1-Minute IntradayPurpose
This script demonstrates a simple intraday approach using RSI, EMAs, VWAP, and an optional volume filter. It plots visual buy (bullish) and sell (bearish) signals on the chart under certain conditions. You can use it as a starting point to explore or develop your own intraday strategies.
Key Features
1. VWAP (Volume Weighted Average Price)
Plots the built-in VWAP for additional context on intraday price action.
2. EMA Crossover
Uses two EMAs (fast and slow). A bullish signal triggers when the fast EMA is above the slow EMA, and a bearish signal triggers when the fast EMA is below the slow EMA.
3. RSI Momentum Filter
An RSI reading above 50 indicates bullish momentum; below 50 indicates bearish momentum.
4. Volume Filter (Optional)
Compares the current bar’s volume against the average volume (over a user-defined period). When enabled, signals only appear if the current volume exceeds the average.
5. Time Window (Optional)
Allows you to define a specific time window (e.g., the first hour of trading) for valid signals. You can enable or disable this filter and set your preferred time zone.
How the Signals Are Generated
• Bullish Signal
o Occurs when:
1. Price is above VWAP.
2. Fast EMA is above Slow EMA.
3. RSI is above 50.
4. (Optional) Current volume exceeds the average volume if the volume filter is enabled.
5. (Optional) The chart’s timestamp is within the specified session if the time filter is enabled.
A green triangle is plotted below the bar, and an optional background highlight is shown.
• Bearish Signal
Occurs when the conditions are inverted (price below VWAP, fast EMA below slow EMA, RSI below 50, volume filter and time window—if enabled—are satisfied).
A red triangle is plotted above the bar, and an optional background highlight is shown.
How to Use
1. Load on a 1-Minute Chart (Recommended)
This script is intended for intraday timeframes (specifically 1-minute). Feel free to experiment with other timeframes.
2. Adjust Inputs
You can modify the RSI length, EMA lengths, and volume lookback to suit your preferences or trading style.
If you prefer signals outside the default session hours, turn off “Use Time Filter for Signals?” or change the session window and time zone.
3. Enable or Disable Volume Filter
Turn this on if you only want signals during higher-than-average volume bars.
4. Combine with Other Analysis
This script can be used as a visual tool; however, it is not a complete trading system by itself. Consider additional technical or fundamental analysis to validate your trading decisions.
5. Risk Management
Always practice sound risk management. Setting appropriate stop-losses or using position sizing techniques can help manage potential losses.
Important Notes and Disclaimers
• Educational Only: This script is for demonstration and educational purposes and does not guarantee future results.
• No Financial Advice: Nothing here should be construed as financial or investment advice. Always do your own research and consider consulting a qualified financial professional.
• Test Before Using Live: If you plan to incorporate this script into a strategy, backtest it on historical data and consider forward-testing on a demo account.
• License: This code is subject to the Mozilla Public License 2.0.

Swing High/Low Pivots Strategy [LV]The Swing High/Low Pivots Strategy was developed as a counter-momentum trading tool.
The strategy is suitable for any market and the default values used in the input settings menu are set for Bitcoin (best on 15min). These values, expressed in minimum ticks (or pips if symbol is Forex) make this tool perfectly adaptable to every symbol and/or timeframe.
Check tooltips in the settings menu for more details about every user input.
STRTEGY ENTRY & EXIT MECHANISMS:
Trades Entry based on the detection of swing highs and lows for short and long entries respectively, validated by:
- Limit orders placed after each new pivot level confirmation
- Moving averages trend filter (if enabled)
- No active trade currently open
Trades Exit when the price reaches take-profit or stop-loss level as defined in the settings menu. A double entry/second take-profit level can be enabled for partial exits, with dynamic stop-loss adjustment for the remaining position.
Enhanced Trade Precision:
By limiting entries to confirmed swing high (HH, LH) or swing low (HL, LL) pivot points, the strategy ensures that trades occur at levels of significant price reversals. This precision reduces the likelihood of entering trades in the midst of a trend or during uncertain price action.
Risk Management Optimization:
The strategy incorporates clearly defined stop-loss (SL) and take-profit (TP) levels derived from the pivot points. This structured approach minimizes potential losses while locking in profits, which is critical for consistent performance in volatile markets.
Trend Filtering for Better Entry:
The use of a configurable moving average filter adds a layer of trend validation. This prevents entering trades against the dominant market trend, increasing the probability of success for each trade.
Avoidance of Noise:
The lookback period (length parameter) confirms pivots only after a set number of bars, effectively filtering out market noise and ensuring that entries are based on reliable, well-defined price movements.
Adaptability Across Markets:
The strategy is versatile and can be applied across different markets (Forex, stocks, crypto) due to its dynamic use of ticks and pips converters. It adapts seamlessly to varying price scales and asset types.
Dual Quantity Entries:
The original and optionnal double-entry mechanism allows traders to capture both short-term and extended profits by scaling out of positions. This adaptive approach caters to varying risk appetites and market conditions.
Clear Visualization:
The plotted pivot points, entry limits, SL, and TP levels provide visual clarity, making it easy for traders to track the strategy's behavior and make informed decisions.
Automated Execution with Alerts:
Integrated alerts for both entries and exits ensure timely actions without the need for constant market monitoring, enhancing efficiency. Configurable alert messages are suitable for API use.
Any feedback, comments, or suggestions for improvement are always welcome.
Hope you enjoy!

MCP Stop Strategy [JARUTIR]The MCP Stop Strategy is a trading tool designed to help traders lock in profits and manage risks. It is based on the concept of setting a MCP (Mental Capacity Preservation) Stop explained in the book "The Lifecycle Trade". I call it Maximum Controllable Profit Stop which helps protect profits once a stock or asset reaches a new peak. The MCP Stop is dynamically calculated based on the Buy Price and the All Time High Price (Peak Price), and is adjusted using a customizable percentage (MCP%) to retain a portion of the gains from the peak price during a drawdown.
Key Features :
MCP Stop Calculation: The script calculates the MCP Stop as:
MCP Stop = Buy Price + (Peak Price - Buy Price) x MCP%
This helps you protect a portion of your gains (defined by MCP%) as the price moves in your favor.
Flexible Buy Date Option:
You can either manually input a Buy Date or let the script automatically detect the Buy Date when the price first meets or exceeds the user-defined Buy Price.
After the Buy Date, the MCP Stop, Buy Price, and Peak Price are plotted on the chart for easy visualization.
Customizable Parameters:
Buy Price: The price at which the asset was bought.
MCP Percentage: The percentage of profit from the peak that you want to retain in case of a drawdown.
Lookback Length: The number of bars to consider when calculating the Peak Price (All Time High).
How to Use the Script :
Set the Buy Price: Enter the price at which you bought the asset.
Set the MCP%: Enter the percentage of profits you want to protect from the peak. For example, if you want to retain 10% of the gain from the peak, set this to 10.
Choose the Buy Date Method:
Automated Buy Date: The script will automatically detect the first bar where the price meets or exceeds the Buy Price.
Manual Buy Date: If you prefer to specify a particular Buy Date, input the desired date and time.
View the MCP Stop and Peak Price: After the Buy Date (either manually or automatically detected), the MCP Stop, Buy Price, and Peak Price will be plotted on the chart.
Monitor the MCP Stop Trigger: The script will alert you when the price falls below the MCP Stop, indicating a potential exit point to protect profits.
Frequently Asked Questions (FAQs):
1. What is the MCP Stop?
The MCP Stop is a dynamic stop-loss level that adjusts based on your Buy Price and the All Time High Price (Peak Price). It protects a portion of your gains from the peak, which is defined by the MCP%. For example, if you set the MCP% to 10%, the script will retain 10% of the gains from the peak and use this as a stop-loss.
2. How does the Buy Date work?
The Buy Date is the date when you entered the position:
If you choose Automated Buy Date, the script will automatically set the Buy Date to the first bar when the price meets or exceeds the Buy Price.
If you choose Manual Buy Date, you can specify a particular date and time when you want the strategy to start calculating and plotting the MCP Stop and Peak Price.
3. What happens if the price falls below the MCP Stop?
If the price drops below the MCP Stop, the script will mark this as a potential exit point, helping you protect profits. A visual alert (MCP STOP) will be shown on the chart when the price reaches or falls below the MCP Stop.
4. Can I adjust the Lookback Length for Peak Price?
Yes, you can customize the Lookback Length (the number of bars the script considers when calculating the Peak Price) by entering a value in the input field. By default, it is set to 1000 bars, which represents a few months of historical data, but you can increase or decrease this based on your trading strategy.
5. Why would I want to use the automated Buy Date?
The Automated Buy Date is useful for traders who want the script to automatically track the Buy Date when the price first reaches or exceeds the Buy Price. This is helpful when you're unsure of the exact entry date but know the price at which you bought the asset. It simplifies the process by eliminating the need for manual input.
6. Can I use this strategy for long and short positions?
The current version of this script is designed for long positions, where you buy an asset and want to protect your profits as the price increases. If you're interested in applying it to short positions, you would need to adjust the logic accordingly (e.g., tracking the lowest price instead of the peak price).
7. Can I modify the script to fit my trading strategy?
Yes, this script is highly customizable. You can adjust parameters such as Buy Price, MCP%, and Lookback Length to suit your specific trading style. You can also tweak the visual appearance of the plotted lines and alerts.
Disclaimer:
This strategy is intended for educational purposes only. It should not be considered financial advice. Always perform your own research and consult with a professional before making any trading decisions. Trading involves significant risk, and you should never trade with money you cannot afford to lose.

RSI and Bollinger Bands Screener [deepakks444]Indicator Overview
The indicator is designed to help traders identify potential long signals by combining the Relative Strength Index (RSI) and Bollinger Bands across multiple timeframes. This combination allows traders to leverage the strengths of both indicators to make more informed trading decisions.
Understanding RSI
What is RSI?
The Relative Strength Index (RSI) is a momentum oscillator that measures the speed and change of price movements. Developed by J. Welles Wilder Jr. for stocks and forex trading, the RSI is primarily used to identify overbought or oversold conditions in an asset.
How RSI Works:
Calculation: The RSI is calculated using the average gains and losses over a specified period, typically 14 periods.
Range: The RSI oscillates between 0 and 100.
Interpretation:
Key Features of RSI:
Momentum Indicator: RSI helps identify the momentum of price movements.
Divergences: RSI can show divergences, where the price makes a higher high, but the RSI makes a lower high, indicating potential reversals.
Trend Identification: RSI can also help identify trends. In an uptrend, the RSI tends to stay above 50, and in a downtrend, it tends to stay below 50.
Understanding Bollinger Bands
What is Bollinger Bands?
Bollinger Bands are a type of trading band or envelope plotted two standard deviations (positively and negatively) away from a simple moving average (SMA) of a price. Developed by financial analyst John Bollinger, Bollinger Bands consist of three lines:
Upper Band: SMA + (Standard Deviation × Multiplier)
Middle Band (Basis): SMA
Lower Band: SMA - (Standard Deviation × Multiplier)
How Bollinger Bands Work:
Volatility Measure: Bollinger Bands measure the volatility of the market. When the bands are wide, it indicates high volatility, and when the bands are narrow, it indicates low volatility.
Price Movement: The price tends to revert to the mean (middle band) after touching the upper or lower bands.
Support and Resistance: The upper and lower bands can act as dynamic support and resistance levels.
Key Features of Bollinger Bands:
Volatility Indicator: Bollinger Bands help traders understand the volatility of the market.
Mean Reversion: Prices tend to revert to the mean (middle band) after touching the bands.
Squeeze: A Bollinger Band Squeeze occurs when the bands narrow significantly, indicating low volatility and a potential breakout.
Combining RSI and Bollinger Bands
Strategy Overview:
The strategy aims to identify potential long signals by combining RSI and Bollinger Bands across multiple timeframes. The key conditions are:
RSI Crossing Above 60: The RSI should cross above 60 on the 15-minute timeframe.
RSI Above 60 on Higher Timeframes: The RSI should already be above 60 on the hourly and daily timeframes.
Price Above 20MA or Walking on Upper Bollinger Band: The price should be above the 20-period moving average of the Bollinger Bands or walking on the upper Bollinger Band.
Strategy Details:
RSI Calculation:
Calculate the RSI for the 15-minute, 1-hour, and 1-day timeframes.
Check if the RSI crosses above 60 on the 15-minute timeframe.
Ensure the RSI is above 60 on the 1-hour and 1-day timeframes.
Bollinger Bands Calculation:
Calculate the Bollinger Bands using a 20-period moving average and 2 standard deviations.
Check if the price is above the 20-period moving average or walking on the upper Bollinger Band.
Entry and Exit Signals:
Long Signal: When all the above conditions are met, consider a long entry.
Exit: Exit the trade when the price crosses below the 20-period moving average or the stop-loss is hit.
Example Usage
Setup:
Add the indicator to your TradingView chart.
Configure the inputs as per your requirements.
Monitoring:
Look for the long signal on the chart.
Ensure that the RSI is above 60 on the 15-minute, 1-hour, and 1-day timeframes.
Check that the price is above the 20-period moving average or walking on the upper Bollinger Band.
Trading:
Enter a long position when the criteria are met.
Set a stop-loss below the low of the recent 15-minute candle or based on your risk management rules.
Monitor the trade and exit when the RSI returns below 60 on any of the timeframes or when the price crosses below the 20-period moving average.
House Rules Compliance
No Financial Advice: This strategy is for educational purposes only and should not be construed as financial advice.
Risk Management: Always use proper risk management techniques, including stop-loss orders and position sizing.
Past Performance: Past performance is not indicative of future results. Always conduct your own research and analysis.
TradingView Guidelines: Ensure that any shared scripts or strategies comply with TradingView's terms of service and community guidelines.
Conclusion
This strategy combines RSI and Bollinger Bands across multiple timeframes to identify potential long signals. By ensuring that the RSI is above 60 on higher timeframes and that the price is above the 20-period moving average or walking on the upper Bollinger Band, traders can make more informed decisions. Always remember to conduct thorough research and use proper risk management techniques.

MACD Aggressive Scalp SimpleComment on the Script
Purpose and Structure:
The script is a scalping strategy based on the MACD indicator combined with EMA (50) as a trend filter.
It uses the MACD histogram's crossover/crossunder of zero to trigger entries and exits, allowing the trader to capitalize on short-term momentum shifts.
The use of strategy.close ensures that positions are closed when specified conditions are met, although adjustments were made to align with Pine Script version 6.
Strengths:
Simplicity and Clarity: The logic is straightforward and focuses on essential scalping principles (momentum-based entries and exits).
Visual Indicators: The plotted MACD line, signal line, and histogram columns provide clear visual feedback for the strategy's operation.
Trend Confirmation: Incorporating the EMA(50) as a trend filter helps avoid trades that go against the prevailing trend, reducing the likelihood of false signals.
Dynamic Exit Conditions: The conditional logic for closing positions based on weakening momentum (via MACD histogram change) is a good way to protect profits or minimize losses.
Potential Improvements:
Parameter Inputs:
Make the MACD (12, 26, 9) and EMA(50) values adjustable by the user through input statements for better customization during backtesting.
Example:
pine
Copy code
macdFast = input(12, title="MACD Fast Length")
macdSlow = input(26, title="MACD Slow Length")
macdSignal = input(9, title="MACD Signal Line Length")
emaLength = input(50, title="EMA Length")
Stop Loss and Take Profit:
The strategy currently lacks explicit stop-loss or take-profit levels, which are critical in a scalping strategy to manage risk and lock in profits.
ATR-based or fixed-percentage exits could be added for better control.
Position Size and Risk Management:
While the script uses 50% of equity per trade, additional options (e.g., fixed position sizes or risk-adjusted sizes) would be beneficial for flexibility.
Avoid Overlapping Signals:
Add logic to prevent overlapping signals (e.g., opening a new position immediately after closing one on the same bar).
Backtesting Optimization:
Consider adding labels or markers (label.new or plotshape) to visualize entry and exit points on the chart for better debugging and analysis.
The inclusion of performance metrics like max drawdown, Sharpe ratio, or profit factor would help assess the strategy's robustness during backtesting.
Compatibility with Live Trading:
The strategy could be further enhanced with alert conditions using alertcondition to notify the trader of buy/sell signals in real-time.
